
Comparison
Use matched periods, the same metric definition and an explicit branch scope.
Understand sales, collections and product mix.
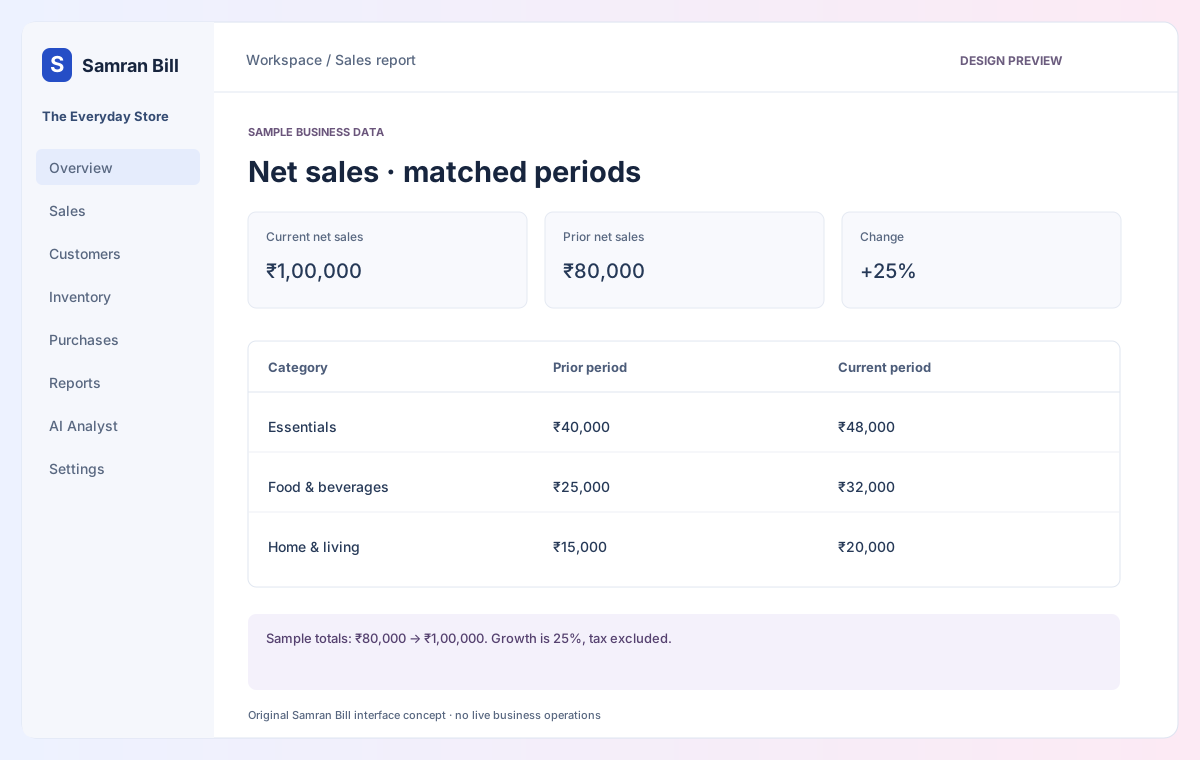
| Category | Prior period | Current period |
|---|---|---|
| Essentials | ₹40,000 | ₹48,000 |
| Food & beverages | ₹25,000 | ₹32,000 |
| Home & living | ₹15,000 | ₹20,000 |
Sample totals: ₹80,000 → ₹1,00,000. Growth is 25%, tax excluded.
| Source | Category | Net sales |
|---|---|---|
| SB-1101 | Essentials | ₹18,000 |
| SB-1102 | Essentials | ₹20,000 |
| SB-1103 | Essentials | ₹10,000 |
These three example invoices reconcile to ₹48,000 in essentials.
Interactive design preview · no live billing backend, AI inference, account creation, uploads or payment. Switching views changes sample content only. Download the original screen design ↗
Move between periods and breakdowns, with definitions and source records available for meaningful comparisons.
Use matched periods, the same metric definition and an explicit branch scope.
Trace a category total to the posted records that contribute to it.
Sales can be known while product costs are missing. Reporting must preserve that distinction.